Introduction
Speech-evoked, auditory event-related potentials or simply the speech evoked potentials (SEPs) described by many contemporary researchers can provide informative value regarding the neural mechanisms that underlie speech processing by the human auditory system.1) Although click stimuli are useful in that they effectively stimulate widely spaced patterns, and synthetic speech sounds allow the investigator to control stimulus dimensions, these stimuli are not fully representative of everyday speech sounds because such stimuli as clicks, tones, and synthetic speech are too brief to evoke the cortical auditory response. In other words, evoked neural response patterns elicited by such brief stimuli do not reflect certain acoustic features that do differentiate these sounds. Indeed, naturally produced speech sounds are highly complex time-varying signals.1,2)
Among several SEPs, the findings about speech perception by many researchers have focused on evoked responses that occur within 250 ms after a sound is presented and generated in the auditory cortex.3) Cortical auditory evoked potentials, such as P1-N1-P2 complex and acoustic change complexes, have been popularly used to assess the neural detection of sound in hearing-impaired individuals as well as in the normal hearing population since the mid-2000's.1,4,5) In particular, the P1-N1-P2 complex can be recorded passively; that is, the subject does not attend to the stimuli, and there is no task for the individual to complete. The P1-N1-P2 complex reflects the sensory encoding of sound that underlies perceptual events, thus providing direct and excellent temporal resolution. When elicited in response to the onset of sound, the complex provides useful information about the neural encoding of the acoustic properties of the signal that allows the behavioral detection of sounds.3)
As a key component of the P1-N1-P2 complex, N1 has multiple generators in both the primary and the secondary auditory cortexes, and its component is often described as an "onset" response, because complex signals the neural encoding of sound onset at the level of the auditory cortex. That response is described as "obligatory" or "sensory", meaning that it is evoked by any acoustic stimulus with a well-defined onset, regardless of the listener's task or attention state.6) The latency, amplitude, and localization of the N1, however, could vary reliably when certain acoustic and perceptual parameters also vary. P2, the last component, seems to have multiple generators located in multiple auditory areas, including the primary auditory cortex, the secondary cortex, and near Heschl's gyrus. In short, the N1 and P2 peaks generate responses of the auditory cortex situated on the superior plane of the temporal lobe (on the lower side of the Sylvian fissure) in common, while also usually corresponding to the onset of the consonant.1)
In 2001, Phillips fully summarized the view that speech perception involves a mapping from continuous acoustic waveforms onto discrete phonological units that are used to store words in the mental lexicon.3) According to his explanation, when we hear the word 'ice', we map a complex and continuous pattern of vibrations at the tympani membrane onto a phonological percept that has just three clearly distinct pieces; /a/, /y/, and /s/. Some of the evidence indicates that this mapping from sound to word is not a simple one-step process, but rather is interfered with by a number of representation levels. Thus, cortical responses evoked by the simplest unit, e.g., a consonant-vowel syllable, provide an opportunity to clearly assess the auditory pathways engaged in the acoustic analysis of speech. The study by Ostroff, et al.7) supported the notion that those multiple N1 components appear to derive from responses to distinct acoustic events within complex speech sounds. They observed an evoked response of the consonant-vowel syllable /sei/ and also studied whether acoustic events within this syllable would be evident in the components of the evoked response for isolated consonant and vowel elements. To isolate the contribution of each acoustic event, evoked N1 and P2 responses were measured in response to the entire syllable /sei/ as well as to its extracted sibilant /s/ and vowel /ei/. The results demonstrated that the evoked responses elicited by each consonant and vowel element demonstrated sound onset that was consistent with the entire syllable in latencies. Compared to the consonant part, the response in the vowel part showed a smaller amplitude, and the evoked response of the vowel within the entire syllable carried a larger amplitude than the response elicited by the isolated vowel stimulus. The authors proposed that SEPs effectively reflect phonetic contrast.
Nevertheless, there remains a lack of physiologic and objective data in human speech perceptual study, especially within the Korean language which differs in phonological characteristics and in speech sound acquisition and developmental patterns for the phonological processes.8) Therefore, it is s necessary to explore some of the more general characteristics of the P1-N1-P2 complex, and the cortical responses to naturally produced Korean speech signals should be further established.2) This study proposed to differentiate perceptually human cortical responses depending on place and manner of articulation, and to characterize the difference between Korean acoustic features of naturally produced sounds and the neurophysiolgocal responses at the auditory cortex level.
Subjects and Methods
Subjects
A group of 11 (2 male and 9 female) participants between the ages of 22 and 25 (mean: 22.90 years old) were randomly recruited. These participants reported a negative history of head or neck abnormalities, ear surgery, otologic disease, or head trauma. They also passed normal criteria upon hearing screening to ensure A-type of tympanogram (admittance, Ōēź0.2 mL; tympanometric width, <200 daPa) and sensitivity of 15 dB HL or better in each ear at 250 to 8000 Hz and air-bone gaps no greater than 5 dB HL. All were right-handed and native Korean speakers and completed the informed consent form.
Stimuli
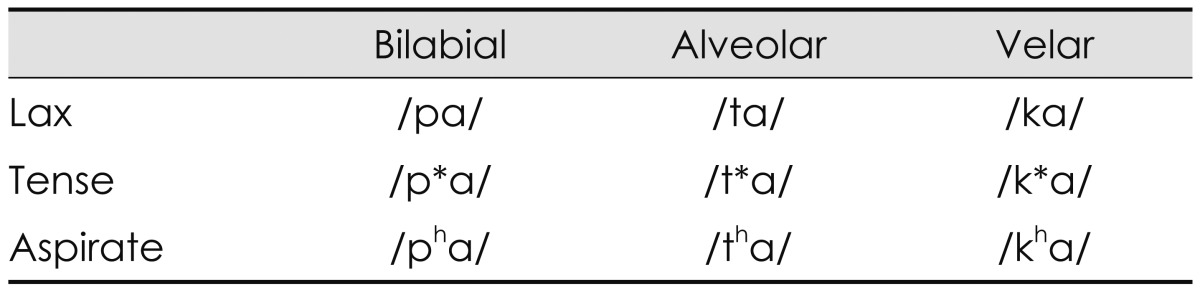
The speech syllables were a combination of nine Korean consonants and an /a/ vowel, which were /pa/, /p*a/, /pha/, /ta/, /t*a/, /tha/, /ka/, /k*a/, and /kha/ from the monosyllable test9) and naturally recorded by a male speaker. As classification in the place of articulation, /p, p*, ph/ are bilabial stops that involve both lips as the articulator. /t, t*, th/ are alveolar stops articulated with the tongue against or close to the superior alveolar ridge, so named because it contains the alveoli of the superior teeth. Further, /k, k*, kh/ are velar stops articulated with the back part of the tongue against the soft palate. According to the manner of articulation, these three groups also consist of lax, tense, and aspirate consonants. Lax /p, t, k/ consonants are produced with little aspiration of air; tense /p*, t*, k*/ are created by a tight glottal constriction; and aspirate /ph, th, kh/ consonants need a strong puff of air or heavy aspiration.10) This classification of consonants reflects a characteristic of the Korean language that is not found in most other languages including English,8) resulting in the Korean cases being unique.11)
Table 1 classifies the nine Korean plosives depending on place (column) and manner (row) of articulation, while Fig. 1 shows their acoustic waveforms.
Acoustic analysis of stimuli
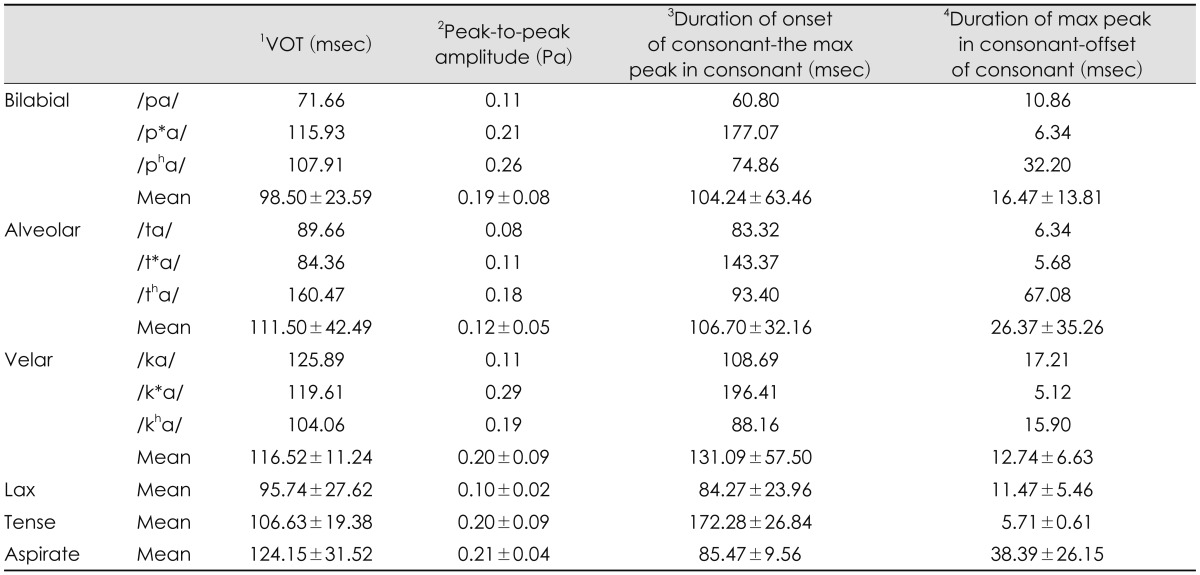
First of all, voice onset time (VOT), one of the most popular acquisition cues, was considered as a temporal gap between release of the burst in a stop consonant and onset of vowel (in msec).12,13) With the Praat acoustic program (Boersma & Weenink, Univ. of Amsterdam, Amsterdam, the Netherlands), VOT was visually defined as time between release of consonant burst and the first pulse (starting point of vocal cycle within vowel) that also corresponded with beginning of formant transition time (see the mark 1 of Fig. 2). Second, peak-to-peak amplitude of the stimulus was measured. Values of the maximum peak were measured within consonant portion. In the waveform, amplitude value calculated a difference between the most positive peak and the most negative peak (amplitude in Pascal) (see the mark 2 of Fig. 2). Third, duration from onset of consonant to the maximum peak in consonant was gauged (see the mark 3 of Fig. 2). A time was measured between onset, the first peak, of syllable and the maximum peak of consonant part (msec). Finally, duration from maximum peak in consonant to offset of consonant was measured. A time was measured between the maximum peak of consonant and onset of vowel. The point, in which the maximum peak of consonant was, was subtracted from offset of consonant (msec)(see the mark 4 of Fig. 2). Those four measurements of the acoustic analysis were documented in Table 2.
In the place of articulation, VOT of bilabial syllables was approximately 13-18 msec shorter than that of the alveolar and velar syllables. Alveolar syllables showed the smallest peak-to-peak amplitude, compared to the bilabial and velar syllables. Velar syllables had the longest duration from onset of consonant to the max peak in consonant, whereas they had the shortest duration from max peak in consonant to offset of consonant. As the group of manner of articulation, lax syllables had the shortest VOT and duration from onset of consonant to the max peak in consonant, and the smallest peak-to-peak amplitude. Tense syllables showed the longest duration from onset of consonant to the max peak in consonant and the shortest duration from max peak in consonant to offset of consonant. Aspirate syllables had the longest VOT, including the longest duration from max peak in consonant to offset of consonant.
Electrophysiological testing procedure
Each plosive stimulus was 500 msec in duration, and the inter-stimulus interval was 1000 msec. Sampling frequency and sampling bit were adjusted to 48000 Hz and 16 bit and mono sound, respectively. The root mean square was also adjusted. Stimulus intensity level was 75 dBnHL, and the stimulus interval was 1.1 sec. Evoked recordings were filtered from 1 to 100 Hz. Responses were amplified with a gain of 50000, and the recording window was 0 to 500 msec. Artifacts were rejected during the test if located at 95 mV or above. Two channel-electrodes were placed at Cz as a reference and at A1 and A2 as active and ground, respectively (Bio-Logic Navigator Pro System; Bio-Logic system Corp., Mundelein, IL, USA) and stimuli were presented to the right ear by an inserted earphone. The test took approximately 90 min to complete [100 presentations for each stimulus (at about 10 min), thus, 10 min├Ś9 stimuli=90 min per participant listener].
Data analysis
Each absolute P1, N1, and P2 latency, and the interlatencies of P1-N1 and N1-P2 obtained from 11 participants for three places and three manners of articulation were compared using a two-way analysis of variance (ANOVA) (SPSS ver. 19, IBM Inc., New York, NY, USA) to determine the significant difference between the cortical evoked responses in terms of timing. Interamplitudes of P1-N1 and N1-P2 for the place and manner of the articulation were compared using a two-way ANOVA to determine how large were the responses evoked. Tukey honestly significant difference (HSD) was used for the post hoc test, and a bonferroni correction was performed for a confidence interval adjustment of significant main effects and interactions. In addition, one-way ANOVA and a post hoc Tukey HSD test were used to compare each P1, N1, and P2 latency, interlatency, and interamplitude of the individual nine plosives. The criterion used for statistical significance was p<0.05.
Results
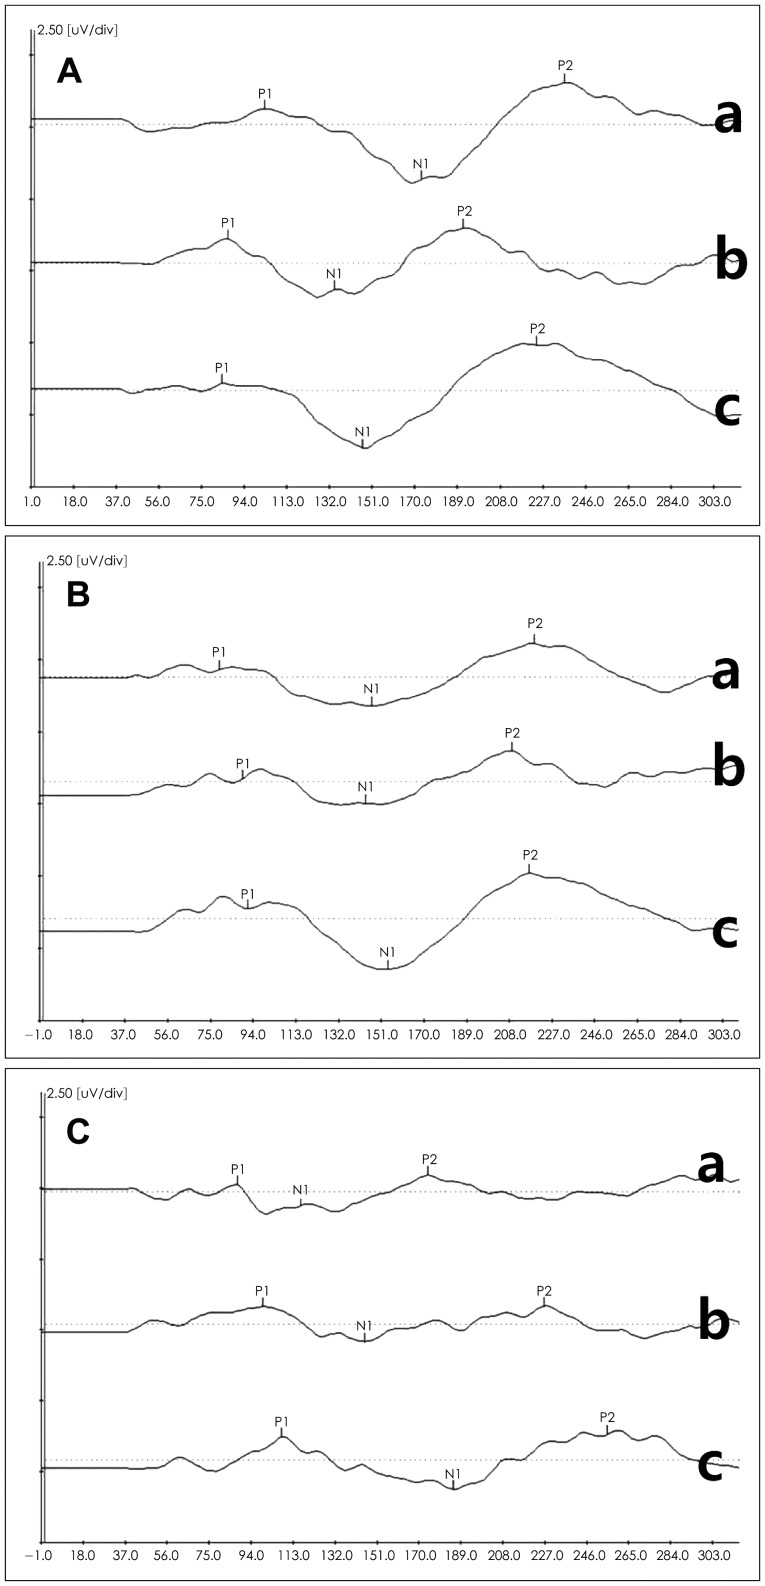
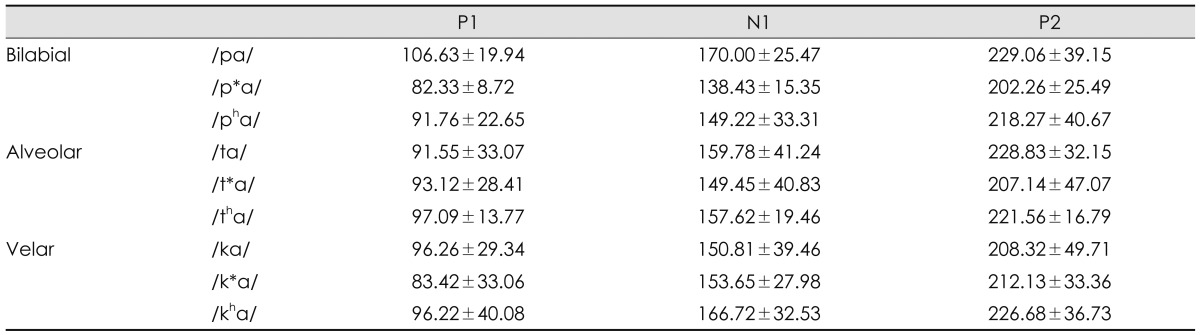
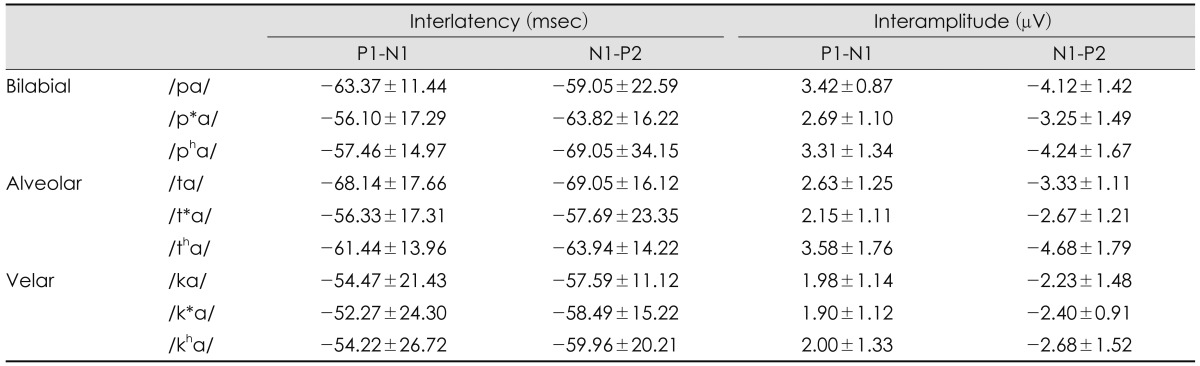
Fig. 3 presents grand-averaged waveforms in responses to the nine plosives in 11 normal hearing young adults. A, B, C panels were waveforms of the bilabial, alveolar, and velar syllables, respectively. Each panel had lax, tense, and aspirate sounds in a top-down order. Based on the values of P1, N1, and P2 peaks, their latencies, interlatencies, and interamplitudes are summarized in Table 3 and 4.
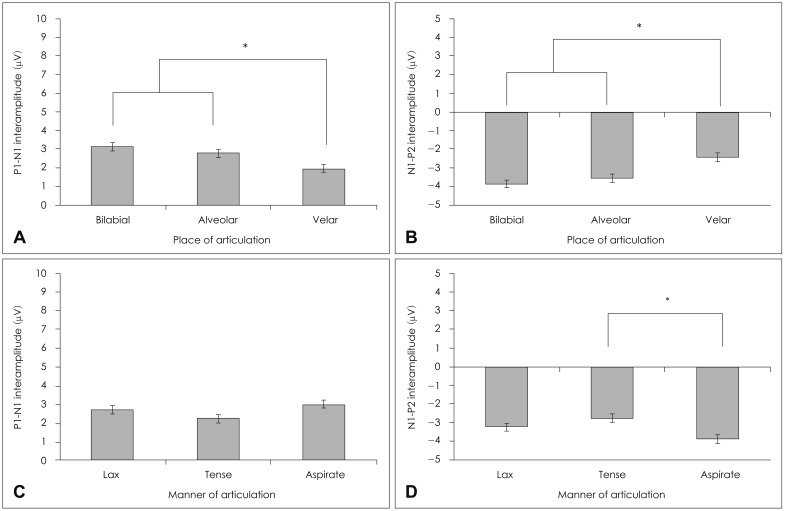
In place of articulation, there were no statistically significant differences in P1 latency [F(2,88)=0.05, p=0.95], N1 latency [F(2,88)=0.16, p=0.85], P2 latency [F(2,88)=0.08, p=0.92], P1-N1 interlatency [F(2,88)=1.60, p=0.21], and N1-P2 interlatency [F(2,88)=0.66, p=0.52]. However, there was a significant interamplitude difference of P1-N1 [F(2,88)=7.49, p=0.00] and of N1-P2 [F(2,88)=8.92, p=0.00]. The post hoc Tukey test for the P1-N1 interamplitude showed bilabial (mean=3.14) and alveolar (mean=2.79) syllables were significantly different from velar (mean=1.96) at p<0.05; yet, the bilabial syllables were not significantly different from the alveolar syllable (Fig. 4A). In the post hoc Tukey test of the N1-P2 interamplitude, the velar syllables (mean=-2.43) showed a significant difference from the other two groups; but there was no significant difference between the bilabial (mean=-3.87) and alveolar (mean=-3.56) syllable (Fig. 4B).
In the manner of articulation, there were no significant latencies {P1 latency [F(2,88)=1.70, p=0.19], N1 latency [F(2,88) =1.53, p=0.22], P2 latency [F(2,88)=1.79, p=0.17]}, interlatencies {P1-N1 interlatency [F(2,88)=1.17, p=0.31], and N1-P2 interlatency [F(2,88)=0.36, p=0.69]}, and P1-N1 interamplitude {[F(2,88)=2.70, p=0.07]} difference, except for N1-P2 interamplitude [F(2,88)=4.85, p=0.01]. The post hoc Tukey test of the N1-P2 interamplitude showed the aspirate (mean=-3.90) and tense (mean=-2.77) groups differed significantly at p<0.05; the lax group, however, was not significantly different from the other two groups, resting somewhere in the middle (mean=-3.26)(Fig. 4D). There was no interaction of place and manner of articulation in latency, interlatency, and interamplitude.
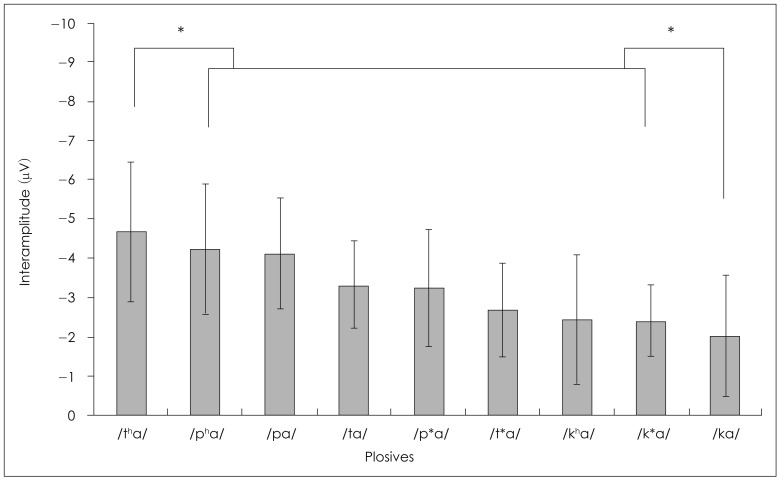
The results of a one-way ANOVA for the nine plosives also showed no statistically significant difference in P1 latency [F(8,88)=1.27, p=0.27], N1 latency [F(8,90)=1.27, p=0.27], P2 latency [F(8,90)=0.82, p=0.58], P1-N1 interlatency [F(8,90)=0.69, p=0.70], and N1-P2 interlatency [F(8,90)=0.82, p=0.59], and P1-N1 interamplitude [F(8,90)=2.97, p=0.06]. Only the N1-P2 interamplitude showed a significant difference [F(8,90)=4.60, p=0.00]. The post hoc Tukey test of N1-P2 interamplitude showed /tha/ (mean=-4.68), and the /ka/ (mean=-2.02) syllables differed significantly from the other seven syllables, resting at the highest and lowest mean values, respectively (Fig. 5). There was also no interaction for the nine plosives in terms of latency, interlatency, and interamplitude.
Discussion
The recent years have seen a great increase in the findings for how speech is encoded in the human brain, and electrophysiological techniques have played a central role in this research. However, the extent of that understanding is still very limited.3) The present study explored the cortical evoked responses of the P1-N1-P2 complex to study the perceptual contributions of the acoustic features, when using nine Korean plosives.
Our results show that the N1component of the P1-N1-P2 complex plays a crucial role in perceiving the onset of consonant with a significant difference1) in interamplitudes although N1 latency was not of statistical significance. This result is consistent with Sharma, et al.14) who reported that the N1 component primarily reflects sensory encoding of auditory stimulus attributes and precedes more endogenous components, such as N2 and P2, which are concerned with attention and cognition. Interamplitude was more significant than latency (i.e., a time between stimulus and response) and interlatency (i.e., a time between response and next response) and distinguished the Korean plosives at the auditory cortex level. In other words, interamplitude of N1 could be explained by increased attention to the stimuli. Results of Dorman's15) earlier study supported our findings in that differences in amplitude of SEPs reflected the differences in phonetic category, while also indicating that the N1-P2 interamplitude may reflect neural encoding that contributes to categorical perception.
Effects of the place of articulation for cortical responses
Unlike other languages,1,5,7) our results indicate that there were no statistically significant differences in P1, N1, and P2 latency and interlatency in the Korean plosives regardless of acoustic difference. However, the data present here show that the N1 interamplitude seems sensitive measure to differentiate three groups in the place of articulation, showing large cortical evoked responses of bilabial and alveolar syllables. This may be due to the longest duration from onset of consonant to the max peak in consonant.
Interestingly, it is reasonably assumed that there is a possible relationship between the duration from max peak in the consonant part to the offset of consonant and N1-P2 intermaplitude. According to our acoustic analysis, the later part of the consonant in /tha/, /pha/, /pa/, /ta/, /p*a/, and /t*a/ was 67.08, 32.21, 10.86, 6.34, 6.34, and 5.68 msec, respectively (Fig. 2 and Table 2, and these durations followed same order to the x-axis (from the largest to smallest interamplitude) in Fig. 5. This observation suggests some directions for future studies of Korean cortical evoked potentials, as velar syllables did not explain that aspect.
Effects of the manner of articulation for cortical responses
Importantly, one of the considerable findings of this study was that there are different articulatory features and different sound acquisition between Korean speakers and English speakers. Numerous researchers in speech perception in various languages have argued for about 60 years that an important cue for voicing in syllable-initial stop consonants is VOT, the time lag between the consonantal release and the onset of voicing. In general, stops with shorter VOTs are perceived as voiced, while stops with longer VOTs are perceived as voiceless, with a sharp perceptual boundary occurring around 30 ms VOT.16) Based on evidence for the perceptual boundary found in young infants17) and nonhuman mammals,18,19) the common assumption has been that the linguistic categories of voicing are built on top of pre-existing perceptual discontinuities. However, the Korean language does not much utilize the VOT, which is of significance in the English phonology, showing that the manner of articulation does not play a crucial role in cortical evoked responses. This fact might extend to thinking that Korean speakers are not sensitive to the VOT for learning English. The primary feature for discriminating among Korean plosives is a tensity one, instead of voicing features. Kazanina, et al.20) support our results, showing a role for voicing in the syllable initial plosive /ta/ and /da/ which differentiates meaning in Russian, but not in Korean. These plosives have a complementary distribution in Korean, so the stimulus pair /ta/ is acceptable in the cortical response, while /da/ is not.
Aspirate sounds, a unique sound in Korean was relatively longer for voicing than the other lax and tense sounds and are produced with a strong aspiration lasting approximately 100 ms.21) It was also found in our acoustic analysis: 107.907 ms for /pha/, 160.474 ms for /tha/, and 104.062 ms for /kha/ (see Table 2). In other words, VOT between English voiced and voiceless sounds is approximately 30 ms, and English voiceless sounds are generally produced with approximately 70-85 ms of voicing delay and aspiration;21) in short, our data suggest that the perceptual boundary for Korean speakers might exist at 100 ms or longer for voicing.
Future direction and applications
Further research should be undertaken to gather the cortical evoked responses of other sets of consonant-vowel syllables and see them also using minimally contrasting word pairs,22) and compare responses of words or syllables in that context with naturalness.23) Moreover, the research has been used for non-native language research as well, including second language acquisition for Korean learners.8) For language-specific speech perception, N├ż├żt├żnen, et al.24) found that the cortical evoked response has a larger amplitude and is dominantly localized in the left hemisphere when a vowel contrast is phonological in the native language. This study should be extended to Korean learners who speak Korean in school but not at home and vice versa. The age of acquisition is difficult to study in that it is questionable to compare adult and child brain responses in terms of certain distorted results that occur through neural maturation. It is also an attractive topic to study in the future. The research needs to consider two alternative views of how infant phonetics representations develop into adult representations, namely, 'a structure-changing view' and 'a structure-adding view'.3) The suggestion is that each may be better suited to different kinds of phonetic categories in infants, young adults, and older people.
Cheour, et al.25) have indicated the development of new neural representations in 3-6 year old Finnish children learning French in an immersion program by measuring their cortical responses to both Finnish and French vowel pairs. A very interesting outcome was that the response to a non-native contrast was significantly enlarged within two months of exposure. On the other hand, as an age effect of perceptual difference, Tremblay, et al.26) suggest that one potential explanation might be age-related refractory differences for younger and older auditory systems. Refractory issues might in turn affect the synchronized neural activity underlying the perception of critical time-varying speech cues and may partially explain some of the difficulties elder people (over 65 years old) experience in understanding speech. Finally, studies of listeners with hearing loss need to be implicated; central auditory system plasticity of normal and impaired listeners is associated with speech detection and discrimination training with millisecond resolution and speech processing deficits in impaired population.
Conclusion
The P1-N1-P2 complex can be recorded in young adults with normal hearing even when using naturally produced Korean speech sounds. Different speech sounds evoked different P1-N1-P2 patterns in the place and the manner of articulation in terms of interamplitude, but not of the latency and interlatency. Future studies, however, should examine the test-retest reliability of these cortical responses and a perception of other sets of syllable, while expanding the effort to second language acquisition, age of acquisition, and the impairment of the human auditory system.